Key Takeaway:
Day 1 built the foundation (data types, relational vs. non-relational, OLTP vs. OLAP, intro to Cosmos DB & Fabric).
Day 2 expanded into file formats, optimized engines (Spark, Databricks), real-time analytics, and integrated solutions (Fabric + Power BI + Event Stream).
Together, the two days gave a holistic view of Azure’s data services ecosystem, showing how raw data flows from ingestion → governance → analytics → visualization.
📅 Azure Data Fundamentals (DP-900) Virtual Training
Day 1 – March 19, 2025:
Core Data Concepts & Non-Relational Foundations
1. Data Types & Formats
-
Structured → rows/columns in CSV or relational DBs.
-
Semi-Structured → JSON (web APIs, system exchange), XML (finance/healthcare), flexible schemas.
-
Unstructured → text, audio, video; massive insights but complex to process.
-
Optimized Formats → Avro (streaming), ORC/Parquet (compressed, efficient for analytics).
-
Blob Storage → binary objects for media & large files.
2. Database Models
-
Relational (OLTP/OLAP): ACID compliance, referential integrity, star schemas for analysis.
-
Non-Relational: key-value, document, columnar; used for flexible/large-scale scenarios like social media.
3. Core Concepts
-
ETL Pipelines → Extract, Transform, Load for preparing clean data.
-
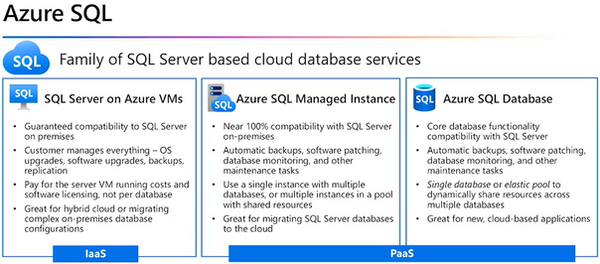
SQL Essentials → Views, stored procedures, indexes; trade-offs of Azure SQL DB vs. SQL Server vs. MariaDB.
-
Partitioning & Keys in non-relational storage for scalability & performance.
4. Azure Services Covered
-
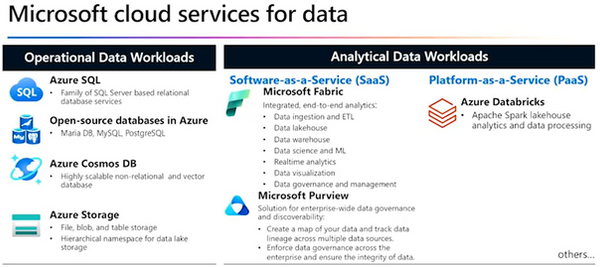
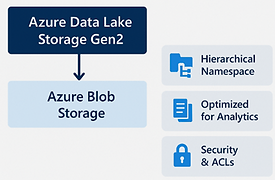
Blob Storage & ADLS Gen2: scalable storage with directory support + analytics integration.
-
Azure Table Storage: simple NoSQL key-value store.
-
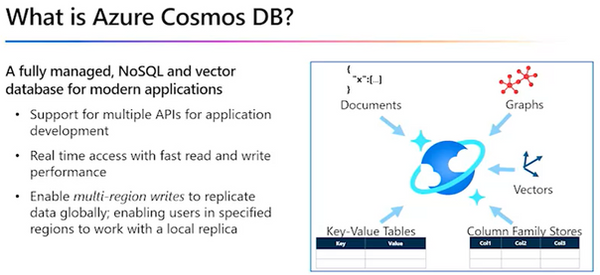
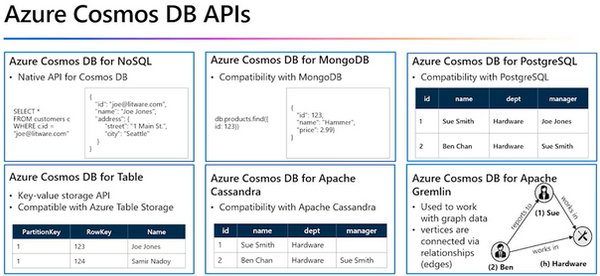
Azure Cosmos DB: multi-API, partitioned, globally distributed database.
-
Azure Synapse & Data Warehousing: structured queries, fact/dimension modeling.
-
Apache Spark & Databricks: batch + real-time analytics on massive datasets.
-
Azure Fabric: SaaS platform unifying ingestion, processing, analytics, and reporting.
5. Advanced Analytics & Real-Time
-
Streaming: compare batch (analyze after collection) vs. real-time (analyze as events flow).
-
Delta Lake + Spark: unify real-time streams with historical data.
-
Event Hubs, Event Stream, KQL: immediate insights (e.g., detecting breaches, IoT events).
6. Visualization
-
Power BI: build dashboards with facts/dimensions, hierarchies, scatter plots, maps, cards.
-
Seamless Fabric integration → instant reporting on governed data.
Day 2 – March 20, 2025:
Data Formats, Processing Engines & Real-Time Intelligence
1. File Formats & Use Cases
-
Delimited (CSV/TSV) → simple, widely used, no schema.
-
JSON → nested, human-readable, core for APIs/IoT.
-
XML → metadata-rich, schema validation (legacy systems).
-
Blobs → binary data like images/videos/backups.
-
Columnar Formats: Avro (streaming), ORC & Parquet (analytics & compression).
-
Tip: Format choice depends on workload (CSV for exchange, Parquet for big data, JSON for APIs, Avro for streaming).
2. Relational DB Deep Dive
-
Azure SQL Database → managed relational service.
-
SQL Server → maximum control, higher cost.
-
MariaDB → open-source, Oracle-compatible.
-
Normalization → reduce redundancy, enforce schema clarity.
3. Non-Relational DB & Storage
-
Cosmos DB → partition + row key structure, indexes, global low-latency multi-region access.
-
ADLS Gen2 → combines blob storage with directory/file system performance for analytics.
4. Big Data Processing
-
Apache Spark → distributed processing for both batch + real-time.
-
Azure Databricks → collaborative, scalable analytics workspace; integrates engineers, analysts, and scientists.
-
Lakehouse Architecture → combines flexibility of a data lake with the structure of a warehouse.
5. Fabric in Context
-
OneLake → centralized repository, eliminates silos/duplication.
-
Fully Managed SaaS → ingestion → analytics → visualization in one pipeline.
-
Integration with Power BI → direct dashboards without separate infra management.
6. Streaming & Real-Time
-
Event Stream + KQL DB → capture events as they arrive for instant analytics.
-
Delta Lake → query historical + real-time data together.
-
Example Use Cases → fraud detection, security monitoring, live dashboards.
7. Visualization & Action
-
Power BI → interactive, real-time visuals layered onto Fabric + Event Stream data.
-
Outcome → end-to-end pipeline: raw data → stream ingestion → analytics → visualization.
